A cancellation survey asks customers why they are leaving, and the words they type often explain more than the reason they click. To read one: 1) keep each person's reason and words in one row, 2) read the words first, 3) group by what people describe, 4) count people, not mentions, 5) keep quotes under every group.
Why the reason chart misleads
Many cancellation flows offer a short list: too expensive, missing a feature, switching to another tool, not using it enough, other. A chart of those clicks is quick to make and easy to present. It is also the part of the survey that tells you the least, and three habits make it worse.
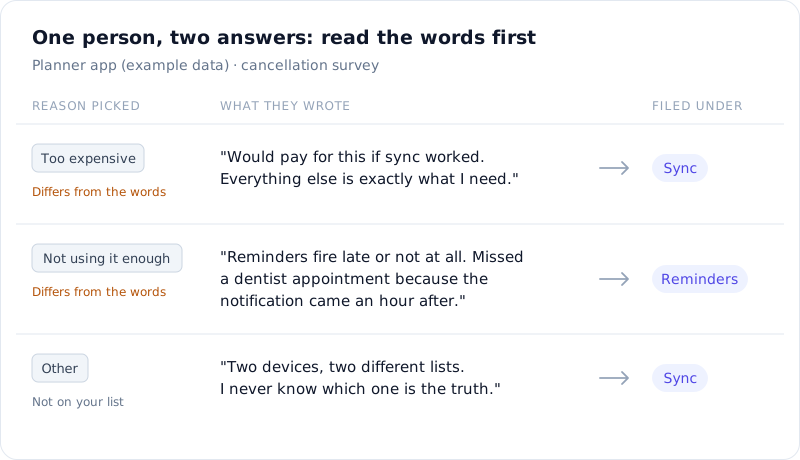
The first is trusting the click. You wrote the list, and the customer's reason may not be on it. Someone whose reminders kept firing late finds no option for that, so they pick the nearest one or "Other". "Too expensive" is also the easy way out: it ends the conversation and nobody argues with it. The words under it can say something else. "Would pay for this if sync worked" is a complaint about sync with a price label on it.
The second is skipping "Other". That box holds every answer that didn't fit your list, so it is where the reasons you never thought of turn up. On the chart it becomes one bar, and the text behind it gets read last, if at all.
The third is reading the two halves apart: the chart in one tab, the typed answers in another. Once a typed answer is cut off from the reason its writer picked, you can't see where the two disagree, and those are the answers to read first.
The method, step by step
1. Ask what happened, then offer the list
If you can still change the survey, put one open question next to the list of reasons and ask about an event: "What happened that made you cancel?" or "What would have made you stay?" Keep the list short and keep "Other" with a text box. A question about a moment gets you something you can act on. "Any other feedback?" mostly gets you a polite goodbye.
2. Keep one row per person
Work from an export where each person's reason, typed answer and date sit on one row. Typeform and Tally exports already look like that. Don't split the file into a sheet of choices and a sheet of comments.
3. Read the words first, then the reason
Read every typed answer before you look at the chart. Give each one a short label in the customer's own terms: what broke, what was missing, what they moved to. Then check the reason they clicked. Where the two disagree, file the answer under what they wrote.
4. Count people, not mentions
An answer about sync and reminders counts once under each. A customer who wrote three times about the same thing is still one customer. Check the count of people before you call anything the top reason.
5. Keep quotes under every group
A group's name is your summary of it, and the answers are the evidence. Keep at least three of them under each name, word for word, with their dates, so anyone on the team can read what customers wrote before agreeing on a fix.
Doing it in RawQuotes
RawQuotes doesn't run your cancellation flow, and it won't tell you which reason to believe. It reads the export, groups what people keep writing into named insights and opens each insight into the exact answers it was counted from.
Export the responses from Typeform or Tally. In RawQuotes, create a survey with the same questions: a choice question with your reasons and an open question for the words. Then import the file into it. The preset takes the date from the export, and a column whose header matches a question's wording is matched to that question for you; check the matches before you import.
Each row becomes one response, so a person's reason and words stay together, and RawQuotes reads them together when it groups. If your export puts typed "Other" answers into the reason column, those cells match none of the options and the preview rejects the row and says why; map that column to the open question instead.
Then open Insights. Each insight is a short name for something people keep writing, with the number of responses behind it. Open it and you read their answers word for word, each with the question it answered and its date. That is step 3 on a short list instead of the whole pile, and "See all" lists every answer behind the count.
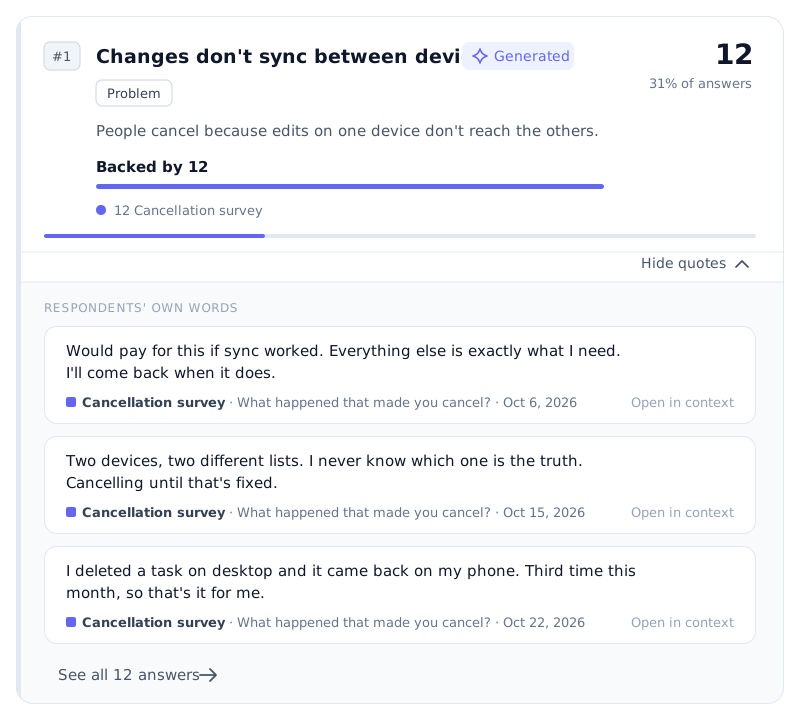
Illustration with example data.
If only a few people cancel each week, you will meet the threshold. Insights are counted per calendar week, Monday to Sunday, or per calendar month. With fewer than ten complete responses in that period, RawQuotes names no insight. It shows how many you have, how many are missing, and a link to read them. One row counts as one complete response whether the person typed anything or only picked a reason, as long as it answers a question marked "Count for insights". If a week is too thin, switch to months, or read the few answers yourself.
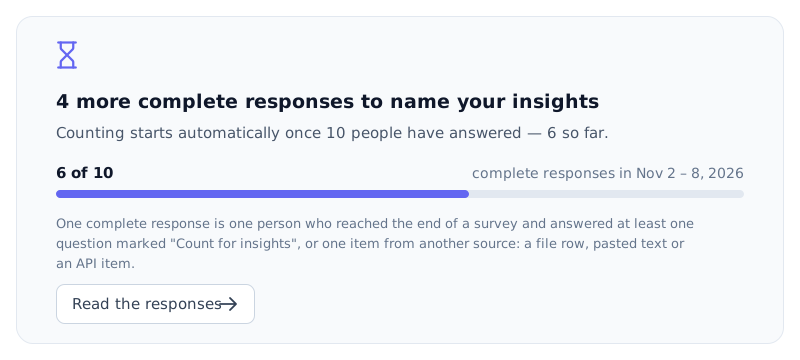
Illustration with example data.
If your export reaches back several months, responses from the current week and month are counted right away. Earlier weeks and months wait until you recompute them, which needs Basic or Pro, and until then each one shows how many responses it hasn't counted yet.
Where this method stops
A cancellation survey only hears from people who chose to answer, at the moment they were leaving. It says nothing about the customers who left without a word, or the ones who stay and complain to nobody. And a typed reason is only what someone decided to tell you on the way out. Use the groups to decide what to look into first, then talk to a few of the people behind the quotes before you rebuild anything.
If you want to read your own cancellation answers this way, see the plans.