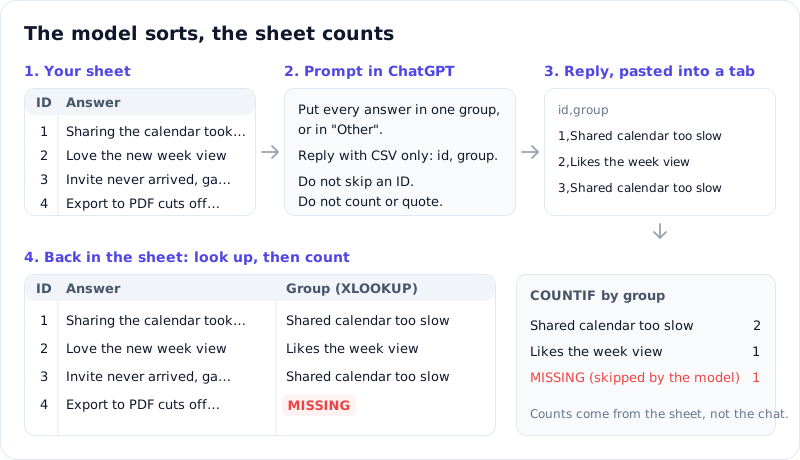
Analyzing open-ended answers with ChatGPT works best when the model only sorts and the spreadsheet counts. In Google Sheets: (1) give every answer a row ID, (2) paste the IDs and answers with a prompt that returns one group per ID, (3) look the groups up back into the sheet, (4) count them with COUNTIF and read each group.
Why "summarize these answers" goes wrong
Paste a column of answers into a chat, ask for the main themes, and you get a tidy list with counts and a few quotes. It reads well, and you have no way to check it. The counts are the model's estimate. A quote may be shortened or reworded. Answers that fit nowhere drop out of the picture without a mention. We wrote about checking an AI summary against the raw answers; the method here builds those checks into the sheet.
The fix is to give the model one job, putting each answer in a group, and keep everything that needs to be exact inside the sheet: the counts, the quotes and the list of answers behind each group.
The method, step by step
1. Give every answer an ID
Insert a column to the left of the answers and fill it with 1, 2, 3 down to the last row. Drag the fill handle rather than using a ROW() formula, so the numbers stay put when you sort. Leave out empty answers and ones like "n/a"; they have nothing to group.
2. Paste the IDs and answers with this prompt
Select the ID and answer columns, copy them, and paste them under the prompt:
Below are answers to the question "<your question>". Each line starts with an ID.

1. Read all of them first. Then list the groups that at least three answers share.
   Name each group in the words people used, not with a category like "Usability".
2. Put every answer in exactly one group, or in "Other" if it fits none.
3. Reply with CSV only: two columns, id and group, one line per answer, in the
   same order. Do not skip an ID. Do not count, summarize or quote.

Answers:
<paste here>
The last line of the prompt matters most. Counts and quotes come from the sheet, so the model has no reason to produce them.
3. Bring the groups back into the sheet
Paste the reply into a new tab called groups, then use Data, Split text to columns. In the main tab, next to each answer, add:
=XLOOKUP(A2, groups!A:A, groups!B:B, "MISSING")
Any row that shows MISSING is an answer the model skipped. Any ID in the groups tab that is not in your sheet is one it made up; =COUNTIF(A:A, groups!A2) returns 0 for those.
4. Count and read in the sheet
A pivot table on the group column, or =COUNTIF(C:C, "<group name>"), gives you counts you can trust, because the sheet did the arithmetic. Then filter the sheet by each group and read what is in it. If a group mixes two different complaints, split it, fix those rows by hand and count again.
Where it breaks
Every row can be checked now, yet three limits remain.
A chat reads a limited amount of text at once. A long column has to go in batches, by ID range, and each batch can name the groups a little differently. Pasting the group list from the first batch into the prompt for the next ones helps, but the mapping is still yours to check.
Counts drift between runs. Paste the same column into two new chats and compare the two groups tabs: names can change and answers can move between groups, so the count you report depends on which run you kept.
There is no period comparison. Next month you paste new answers and get new group names. To see whether a complaint grew, you map this month's groups onto last month's by hand, then divide each count by that month's number of answers, because a count alone misleads when the number of answers changes. The RawQuotes vs ChatGPT page lays out what ChatGPT's own documentation says about file analysis.
Doing it in RawQuotes
RawQuotes does the grouping for you and keeps the counting and quoting exact, as the method above does in the sheet.
In Google Sheets, download the tab with File, Download, Comma-separated values. Upload the file to a project and pick the column that holds the answers. Each row becomes one item. Keep a date column in the file: a column called Date or Timestamp is picked up as the date, and without one every row gets the day you imported it. If the sheet collects Google Forms responses, the Google Forms preset recognises it by its Timestamp column and reads the dates as Google writes them.
RawQuotes groups the answers into named insights. Each insight shows how many answers it was counted from and opens into those answers, quoted word for word, each with its source and date. "See all" lists every answer behind the count, so the count and the list always match. The name and short description are the only text written by the model, and the panel says so.
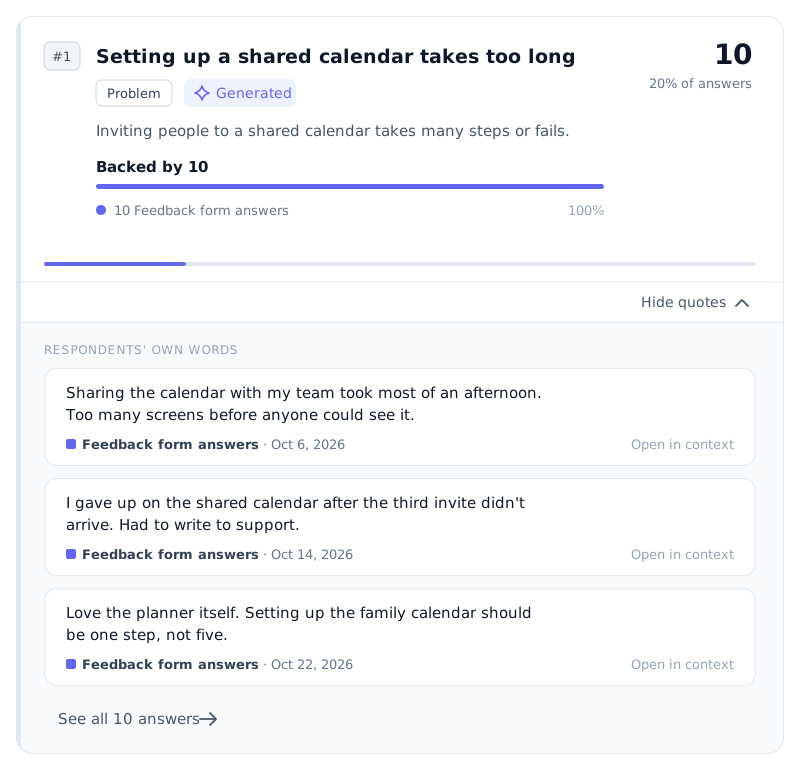
Illustration with example data.
Insights are counted by calendar month or by week, Monday to Sunday. The counts are saved, so opening a month again shows the same numbers until that month is recomputed. When a month is recomputed, the model states which earlier insight each new one continues, so a comparison follows one insight across both months instead of matching two lists of names. Pick two months and each insight shows its share of answers in both and how many percentage points it moved; a problem that grows is marked red.
Answers dated in the current week and month are counted on their own. A sheet usually holds older answers too. For each earlier month, the panel shows how many answers it hasn't counted yet and a "Recompute this month" button, which needs Basic or Pro. On Free, only feedback from the current week and month is analyzed.
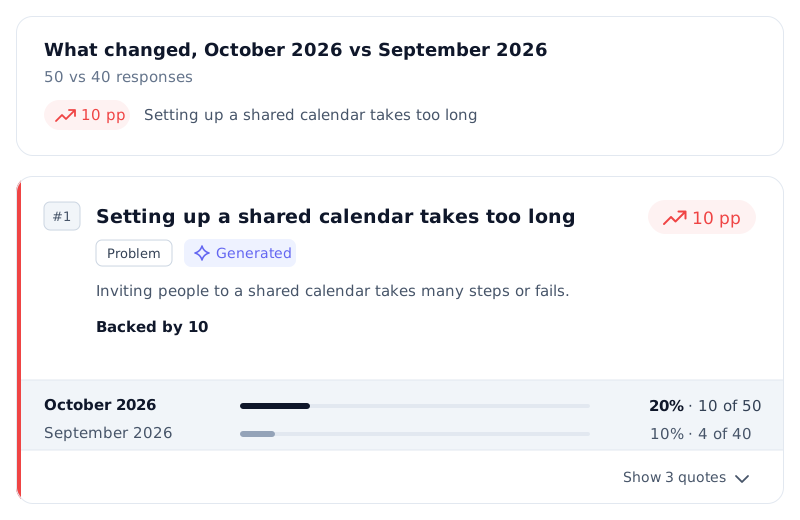
Illustration with example data.
Where this method stops
Under ten complete responses in a period, RawQuotes names no insight and shows the count instead. One row of your sheet is one response. With a short sheet, use the prompt above, or read the answers yourself; at that size reading them is faster anyway.
Grouping is a judgement, in the sheet and in RawQuotes alike. Two people can draw the lines between groups in different places, and nobody has measured how often a model draws them where you would. Open a group and read it before you act on its number.
If you want your sheet grouped this way, with the quotes under every insight, see the plans.